What June showed us, in the open
Georgi Vutov, Founder
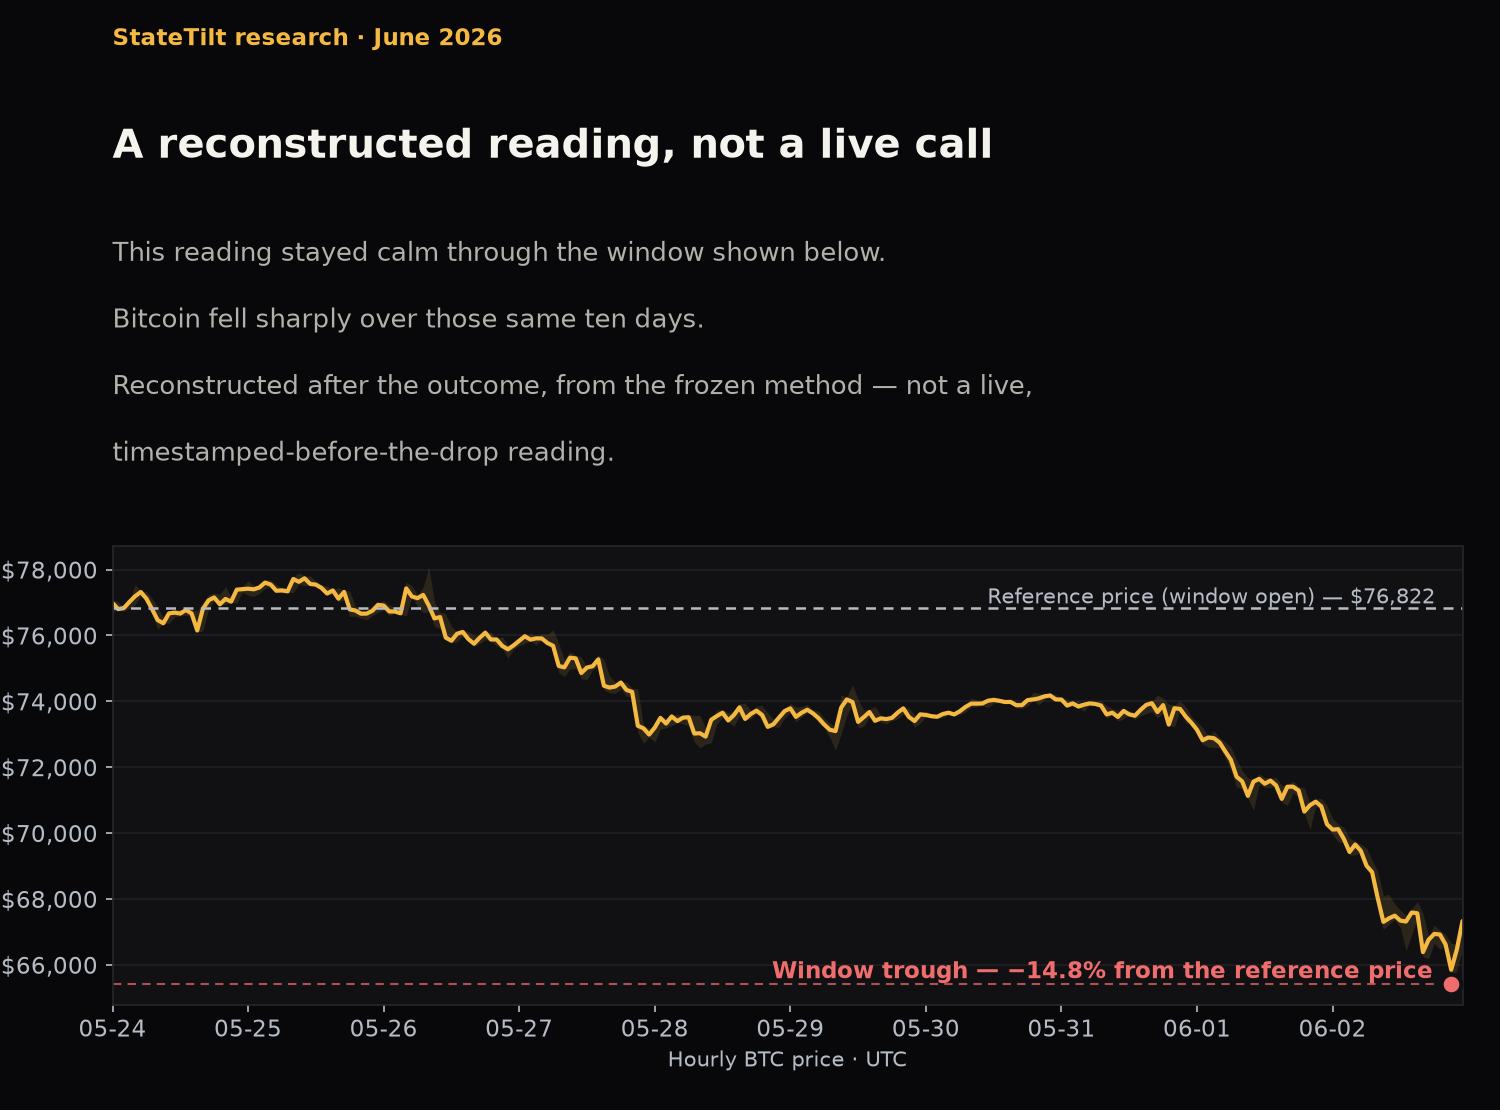
In June, Bitcoin fell sharply. Our daily structural reading stayed calm through that fall — it never read as elevated before the decline, and it read elevated only after the decline was already underway. We’re telling you this plainly, up front, because the whole point of publishing a daily reading is that we don’t get to hide the ones that don’t look good.
This is a descriptive miss, not a method failure. The reading is a description of Bitcoin’s structural conditions, not a sharp-fall forecast — and this is the case where it stayed calm while the market fell anyway.
An honesty note, up front, about these June readings. We did not make a live reading before the fall — nothing here was published or timestamped in real time. What we’re discussing is what our frozen, unchanged method would have produced for those days, reconstructed after the fact from the exact same recipe we run every day. We’re not claiming foresight we didn’t have. We’re showing the reconstruction precisely because refusing to look at a miss is how you fool yourself.
So why did the reading stay calm? A pair of honest reasons.
What the tool is built to read. It reads Bitcoin’s structural conditions — the character of the market’s own price behavior, day to day. Think of it as a building inspector describing whether the structure looks sound or strained. It is not an earthquake-timer. June’s fall appears to have been, in large part, an earthquake: an outside macro shock landing on a market that had quietly grown fragile underneath. Describing a building’s condition and predicting the exact hour of a quake are different jobs, and we’ve said from the start that we do the former.
What the tool can actually see. Its inputs come entirely from Bitcoin’s daily price history. The forces that appear to have led the fall — leverage building up, money flowing out of the funds that hold Bitcoin, forced selling cascading through the market — live in data our current reading simply doesn’t take in. The fragility was real and, in hindsight, had been building for weeks. It just wasn’t visible in daily price alone. That’s a gap in what we measure, not a hidden defect in how we measure it — and we’d rather name the gap than paper over it.
What we will not do: quietly retune the method so that it “would have caught” June. Fitting a method to an outcome you already know is the easiest way to look smart and the surest way to learn nothing. The reading we publish stays frozen. June becomes a case study we study — never an answer we train toward.
What we are doing: we’ve started on the data, not on the capability. A separate collection layer is built and running on its own daily schedule, archiving Bitcoin futures positioning as that data is published, so that anything we build here later has a clean forward record to test against. The capability itself — which would read leverage and flow rather than price alone — does not exist, and none of this reaches the reading we publish today. It would be a new addition, not a patch to the existing reading. We will validate it only on data captured going forward, never on June itself. It will take real forward evidence before we would claim it works, and if it doesn’t, we will publish that too.
And the standard we hold ourselves to is unchanged: anchored daily readings are timestamped on Bitcoin, so an anchored reading’s date is independently provable and any later edit would be detectable. Not every reading is anchored yet, and we mark only the ones that are. These June readings are the exception we flagged above — a reconstruction, not a reading we published live at the time. A public tool to check the record yourself is on the way; we would rather you verify than take our word that we publish the misses.
— Georgi Vutov, Founder
Information only. Not financial, investment, tax, or legal advice. Pre-launch research — we do not yet claim this reading does better than simply holding Bitcoin; that is exactly what we are testing in the open.